Pavement lifecycle modeling empowered Gibson County to achieve sustainable service levels by optimizing roadway spending
Gibson County, Indiana, counted itself fortunate to have a pavement budget large enough to meet its current needs. But a question loomed in the minds of Gibson’s leaders: would it be enough in another decade or more? Are they really spending their money in the right places?
With the help of a robust lifecycle model, Gibson Count saw how their current investment strategy would lead to a steady decline in level of service (LOS) over 40 years, and a fluctuating backlog of treatment work that would never quite go away. A modified strategy, on the other hand, would not only maintain LOS, but could also help them clear their lingering backlog of treatment projects in less than 15 years.
Gibson County’s existing strategy was balanced but not optimized
Gibson County had an annual pavement budget of $2.5 million to spend on 599 centerline miles of paved and gravel roads. The County divided this budget five ways:
- $1.4 million split equally among the County’s three Commissioner Districts for Overlays
- $400,000 for reconstructing paved roads and upgrading gravel roads countywide
- $700,000 for chip seal treatment countywide

On the surface, this distribution seemed fair: each district received the same baseline amount for maintenance, with the remaining $1.1 million being distributed based on eligibility for the proposed treatments. In theory, any differences in treatment-based spending across the counties would balance out over the long term.
But in reality, each district encompassed a different number of centerline miles. The district with the fewest miles could use their portion of the money to maintain a relatively high LOS, while the district with the most miles would struggle to stretch their dollars far enough to keep up with their maintenance backlog.
Pavement lifecycle modeling paints a clear picture of the County’s current trajectory
Gibson County provided several key pieces of data for a pavement lifecycle model:
- Current budget (described above)
- PASER pavement condition scores
- Pavement treatment decisions
- Unit costs
WithersRavenel created a pavement lifecycle model capable of forecasting budget utilization, LOS, and maintenance backlog over a 40-year period.
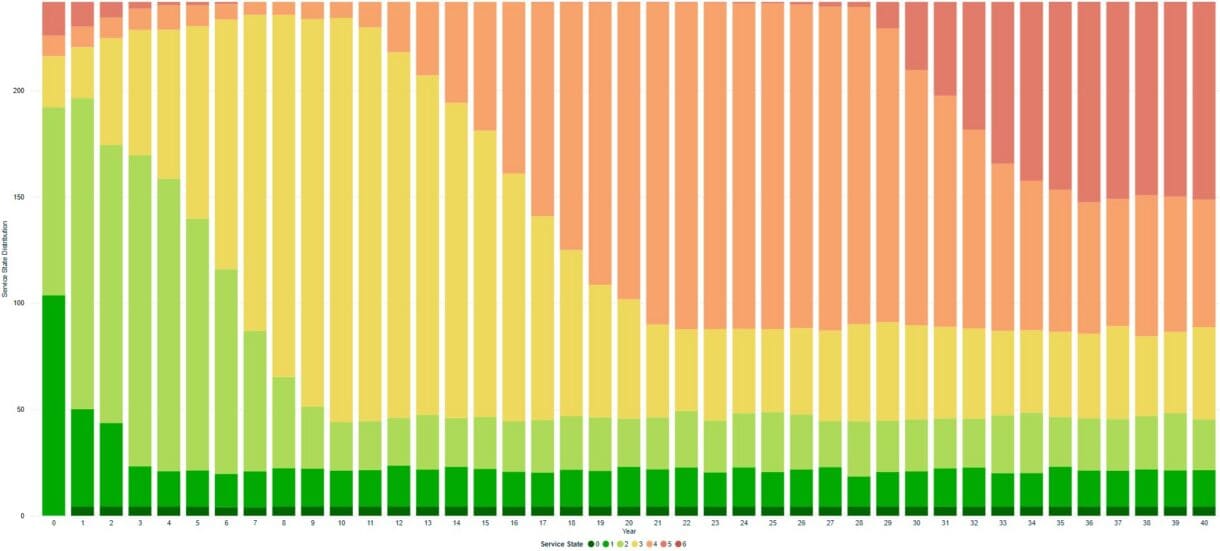
By entering the County’s $2.5 million budget and split-budget approach into the model, WithersRavenel showed that the LOS would steadily decline over the next 40 years.

Specifically, the number of road segments in State 0 would remain roughly the same, the number of segments in State 1 would plummet in the next few years, and the number of segments in State 2 and State 3 would each decline steeply over a period of eight to ten years before leveling off. It would only take about 18 years for the number of bad road segments to equal the number of good ones.
Optimizing the County’s budget would stabilize LOS
To optimize Gibson County’s budget, WithersRavenel posed a simple question: what would happen if funds weren’t restricted by district or treatment type?
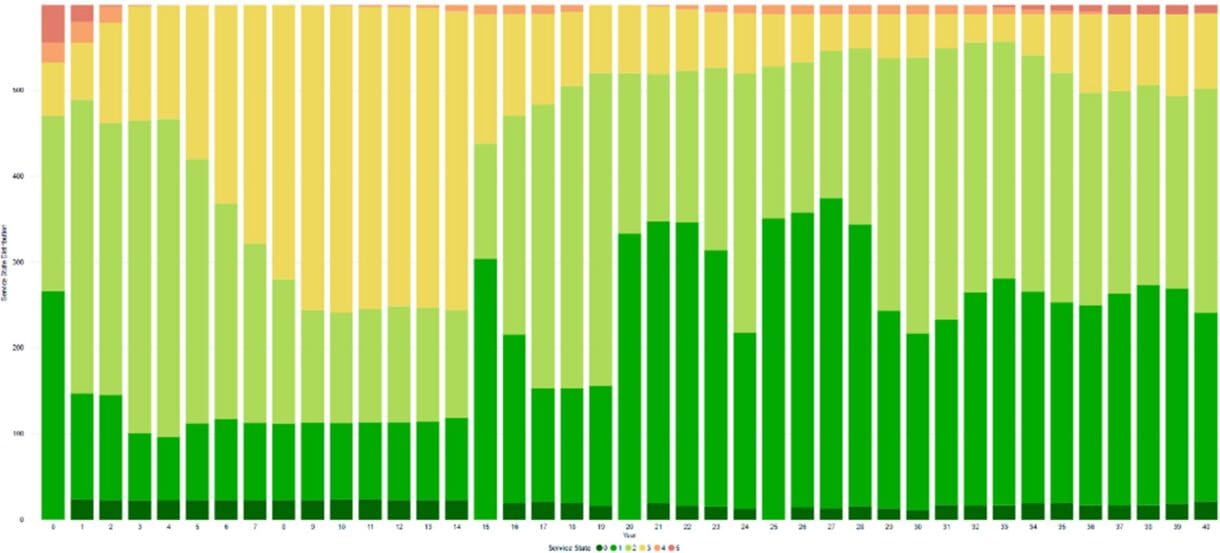
The pavement lifecycle model showed that when the same $2.5 million budget was invested throughout the County without limitations, Gibson County’s LOS remained stable for the 40-year model period.

Optimizing and increasing the County’s budget would stabilize LOS and eliminate backlog
Gibson County leadership liked the idea of keeping a high LOS and minimizing the number of road segments in States 4, 5, and 6. But they also have a backlog of deferred maintenance projects, and they wanted to know what it would take to eliminate it.
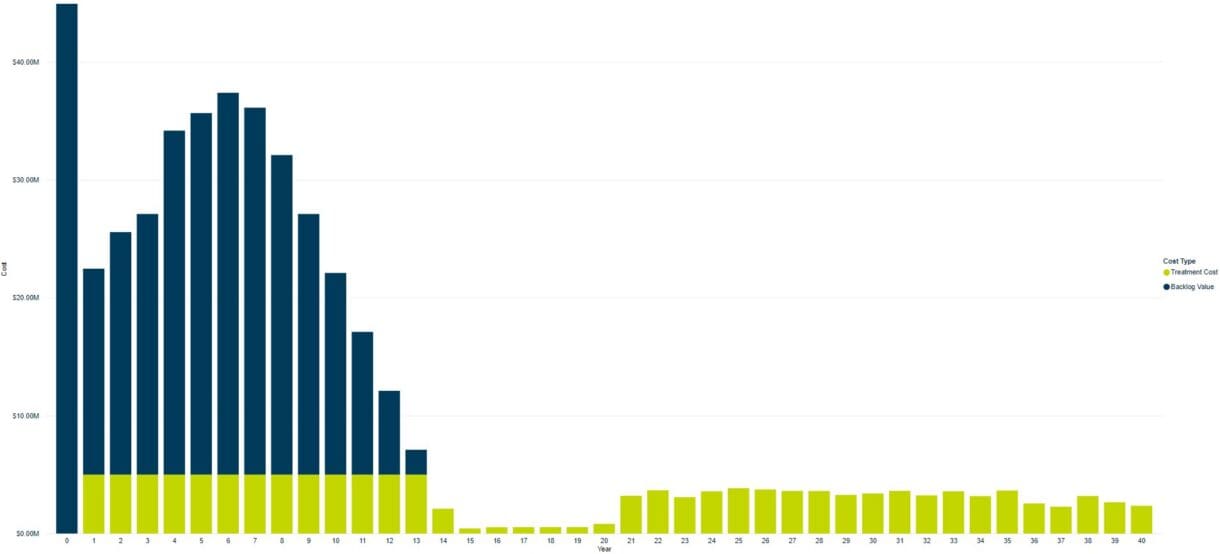
Using the pavement lifecycle model, WithersRavenel showed that lifting the district and treatment limitations and doubling the County’s annual investment to $5 million would be the most effective strategy for eliminating the backlog. It was the only approach that could maintain zero backlog after year 13, whereas other approaches continued to show a backlog that fluctuated but never fully went away over 40 years.
More data, more options
The modeling team emphasized the importance of continually evaluating and updating asset data and then using the updated data to generate new budget scenarios in a process of continuous improvement.
WithersRavenel also encouraged the County to explore other budget strategies, particularly ones that are front-loaded. For instance, the County could seek a budget between $3 million and $5 million for the first five years to reduce the deferred maintenance backlog and then reduce the budget to $2 million annually.
The bottom line
By creating a pavement lifecycle model, Gibson County learned that they could invest the exact same budget but get significantly better long-term results. They are also equipped with the information to make other changes to their investment strategy to balance their desired service levels, investment opportunities, and asset performance.