
A comprehensive land planning document asks a lot of important questions like “What do we want our community to look like?” and “How do we achieve our vision?” Unfortunately, the answers to those questions can end up buried in hundreds of pages of text. For simple, direct, real-time answers to land planning questions, WithersRavenel created LUCID.
What is LUCID?
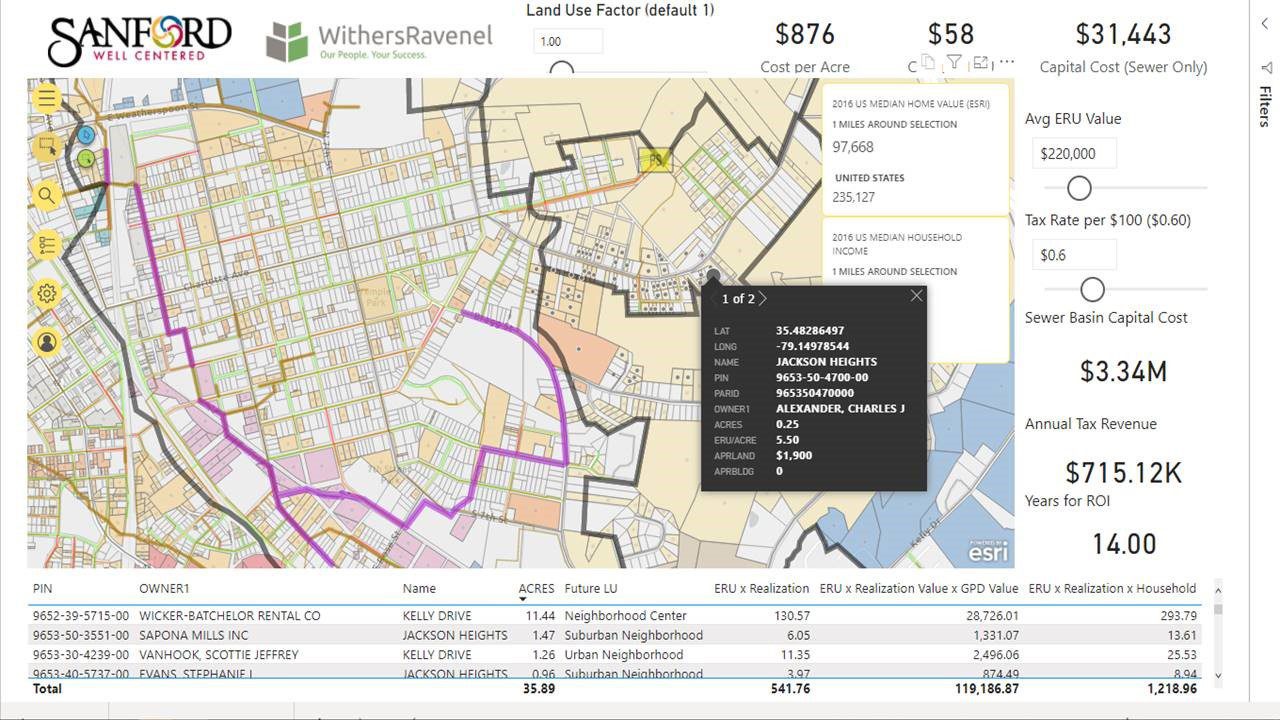
LUCID is a cloud-based asset management solution that provides robust land use data visualization, mapping, and what-if scenario modeling. It transforms static land use plans into dynamic land use models.
LUCID is built on Microsoft Power BI and requires Esri integration.
How does LUCID work?
LUCID starts with a map of a municipal or county jurisdiction with each parcel coded according to its approved land use(s).
Through the LUCID Esri integration, WithersRavenel imports GIS data from the relevant real estate database to assign property values and tax bill amounts to each parcel.
At the client’s request, we can also create additional layers for the locations of major infrastructure, including the following:
- Sewer basins
- Water and wastewater treatment facilities
- Pump stations
- Water and sewer mains
How does LUCID support local governments?
Land use plans tend to be long, dense documents; they are packed with valuable information, but they are difficult to use as a reference and often end up on a shelf. LUCID offers local governments four key advantages over a conventional paper plan:
- Compare the effects of proposed land use changes with just a few clicks. Putting two land use maps side-by-side to do a before-and-after comparison will highlight major changes between the two, but subtler differences may go unnoticed. For instance, how does changing an area’s land use impact the total acreage available for residential development or the number of retail units that can be built? LUCID couples maps with quantitative data for a more informed planning process, allowing communities to shape development patterns around the character they would like to create.
- Predict infrastructure development needs. Changes in land use influence demands for services like utilities and transportation, but how will demands change in your community specifically? LUCID leverages a local government’s own data—rather than general benchmarks—to show how much new developments will increase demand for services. It also calculates the costs of new infrastructure construction and maintenance, making it easier to see whether existing enterprise utility fees, property taxes, and/or general funds will be sufficient to cover the costs.
- More effectively market property for economic development. Economic developers no longer need to rely on static brochures or property advertisements to market available land. With LUCID, they can easily search, sort, and filter developable parcels based on a variety of criteria, including development costs. Armed with this data, they can focus on attracting the right kind of buyer for each area in their community and show tailored property options to interested buyers.
- Quickly evaluate development requests for feasibility and suitability. Whether a community is using digital or paper-based systems, land use and utility asset data are usually housed separately. Deciding whether to approve or reject an initial development proposal becomes an exercise in cross-referencing multiple maps or databases to answer questions like “does the historic district have enough sewer capacity to support a new microbrewery?” or “will a garden apartment complex fit the character of the new tech center?” LUCID eliminates that headache by layering land use and utility asset data in a single interface.
How does LUCID help real estate developers?
Traditional site selection methods are time consuming and involve sifting through real estate listings, visiting possible sites, and performing complex, spreadsheet-based calculations. LUCID offers three major improvements over this traditional approach to real estate developers looking to select a site for their next project:
- Quickly compare property and development costs. Hovering over a specific property reveals details like lot size and development costs. Importantly, those costs include both cost per acre and Equivalent Residential Unit (ERU) of all sewer capital costs. This enables an apples-to-apples comparison and allows developers to avoid properties that require additional infrastructure investment if that is not desirable on their intended project.
- Identify opportunities to combine or subdivide parcels. The map is automatically filtered to show developable properties, and it can be further filtered by intended land use. If the available parcels do not satisfy a project’s needs, the user can click and drag to see the associated costs to develop multiple properties.
- See the proximity of infrastructure and other land uses. In addition to major highways and local roads, the model can incorporate greenway networks, park locations, and schools. This makes it easier for developers to situate retail locations near areas of high foot traffic or housing near existing community amenities.
What’s next?
If you are a real estate developer or investor considering a residential, commercial, or mixed-use development project, reach out to the relevant jurisdiction and ask if they have an interactive land use model.
If you are a local government interested in transforming a static land use plan into a dynamic land use model, contact Eddie Staley to find out how WithersRavenel can help you to get started.
