When utility owners have a comprehensive view of their systems, they can look ahead for creative ways to plan for future projects. The City of Sanford is doing just that: with the help of WithersRavenel, they are taking proactive asset management to the next level by integrating a sewer model and land use plan to chart a financial course through the 2045 planning horizon.
Sewer Asset Management Plan Update
The City of Sanford’s journey began with a routine sewer asset management plan update. WithersRavenel’s GIS team completed this update in three phases:
- During Phase I, WithersRavenel worked with the City to develop a set of Key Performance Indicators (KPIs). These KPIs focused on answering the most urgent questions of both the internal utility management staff and external utility stakeholders.
- During Phase II, WithersRavenel determined the risks to the system and developed an action plan to mitigate them. This risk assessment formed the basis of the updated asset management plan and an accompanying sewer capital improvement plan.
- During Phase III, WithersRavenel updated the City’s GIS data and data management schema in ArcGIS.
For most clients, this is where WithersRavenel’s work would end. The client, completed asset management plan and capital improvement plan in hand, has everything they need necessary to prioritize future rehabilitation and replacement projects.
The City of Sanford, however, wanted to take things a step further. They wanted to understand how different levels of funding for asset improvement projects would affect the overall condition of their sewer system over the next 25 years. What they did not want was a binder full of tables showing pipe lengths, locations, and coststhe typical deliverable for such a project.
Interactive Sewer Model
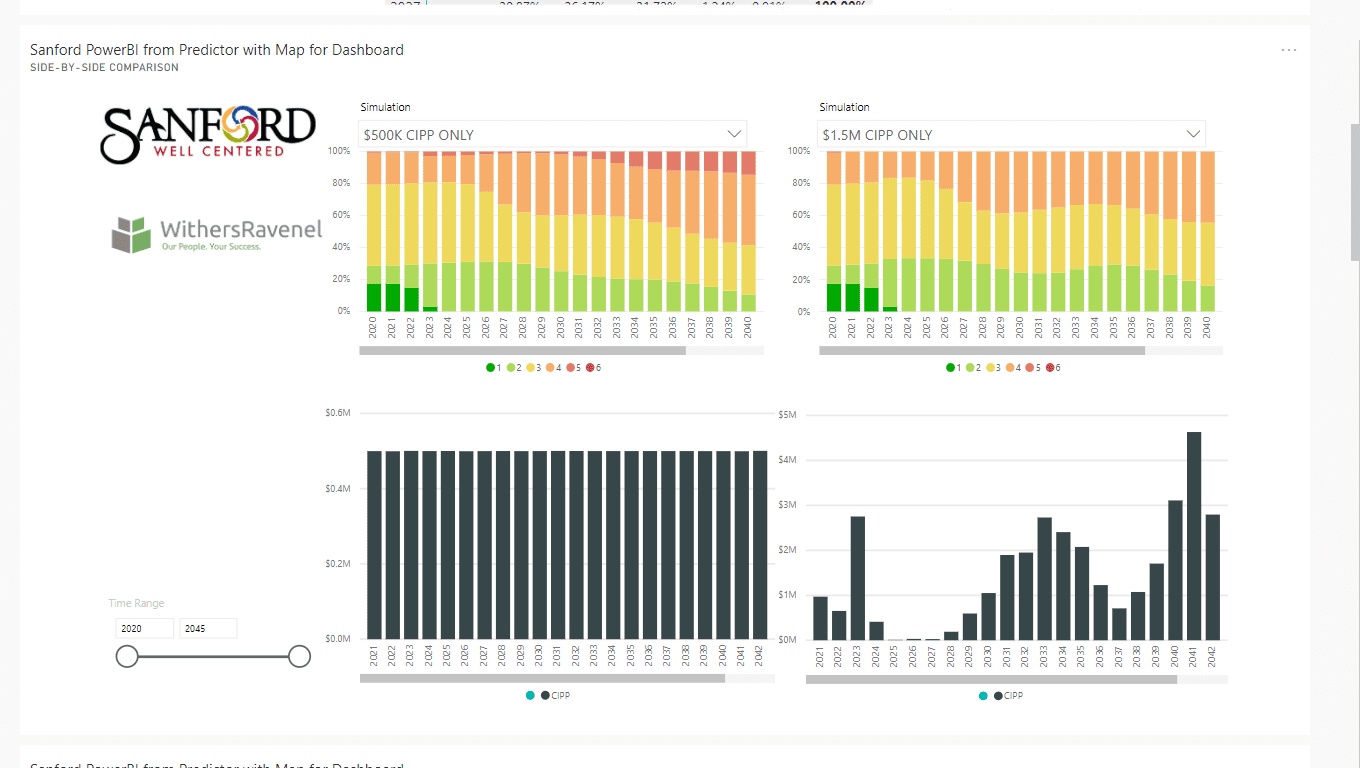
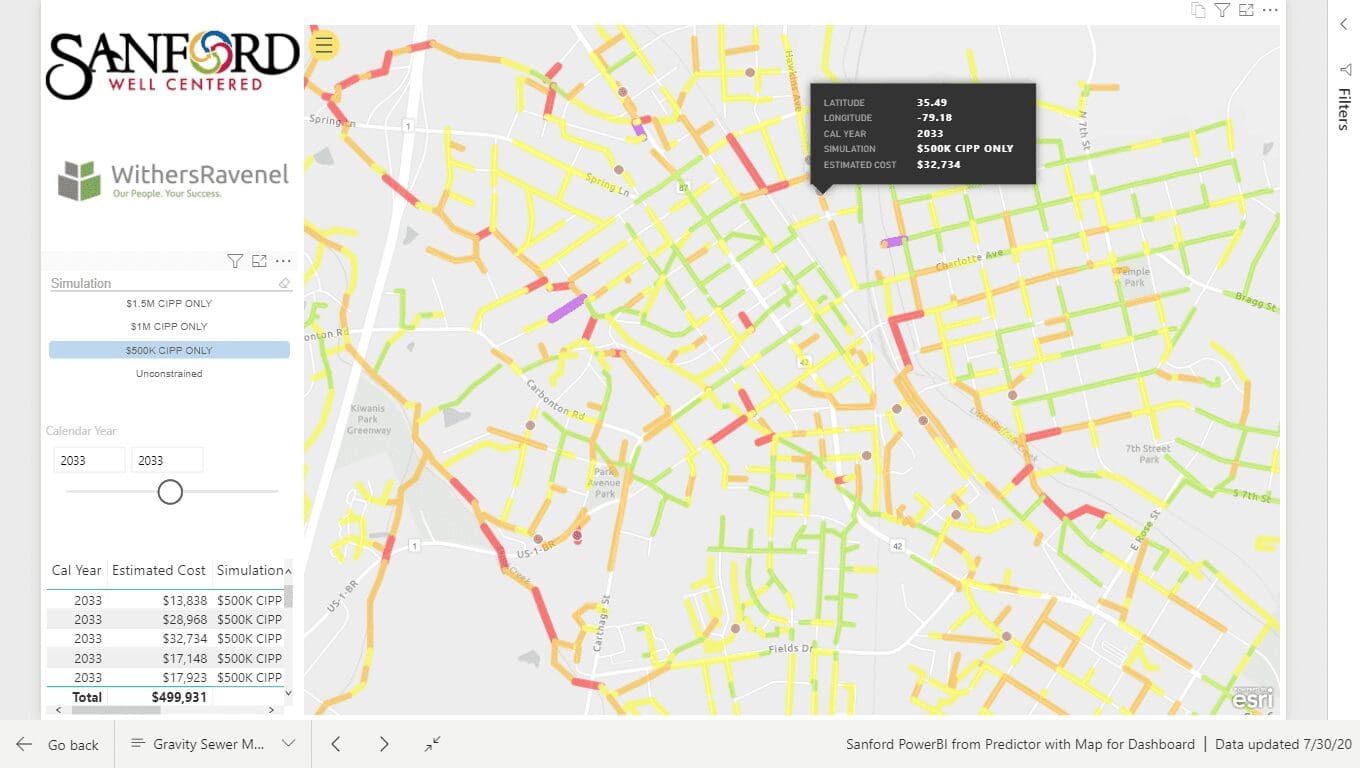
In response, WithersRavenel’s GIS and Funding & Asset Management teams created an interactive sewer model linked to the City’s ArcGIS database. The model was created using Brightly Capital Predictor¢ and is presented in a dashboard with three primary views:
- A color-coded line map, which shows the location and condition of all of Sanford’s City-owned sewer infrastructure
- A service life graph, which shows the distribution of like-new, young, middle-aged, old, and failed infrastructure by year
- A cost graph, which shows the cost to maintain the system each year
Each of these views offers the user a simple drop-down menu to toggle between the current rehabilitation program and hypothetical programs that allocate $500,000; $1,000,000; or $1,500,00 per year to repair projects. It also allows the user to slice the data into multi-year time spans, or drill down into the specifics of a single year. Users can compare the outcomes of different funding approaches, and changes are reflected in real time.

The map view allows users to visualize rehabilitation projects spatially and explore additional “what-if” scenarios. For instance, the user can set the year filter to display the map as it is expected to look in 2025 to determine where the highest concentration of end-of-life assets will be located at that time. After identifying a segment of sewer line in urgent need of repair, the user can quickly and easily click and drag to select the neighborhood and find out the cost to repair all of the surrounding sewer at the same time.

The result is an information-rich but easy-to-understand model of the City’s sewer infrastructure. It not only displays the potential financial consequences of deferred maintenance, but also provides tools for prioritizing projects based on urgency and on proximity to other projects. It also provides supporting documentation should the City choose to pursue grant funding from the state or federal government.
If there were one flaw with the sewer model, it would be that it only addresses maintenance of the current systemit does not account for any future growth. For that reason, the City and WithersRavenel teamed up again to create an even more robust land use model to understand potential future growth and its effect on the sewer system.
Interactive Land Use Model
A few years ago, the City of Sanford revised its comprehensive land use plan. The purpose of the revision was to align the land use plan and the ordinances based on it with the vision the City has for itself. As part of this process, the City defined descriptive land use categories like Urban Neighborhood, Countryside, and Maker District, and identified where it would like to see these areas developed.
WithersRavenel took this information and entered it into ArcGIS. Then we added a layer for the locations of the major sewer basins, wastewater treatment plant, pump stations, and sewer mains. Next, we imported data from the City’s real estate GIS database, which includes property values and tax bill amounts.
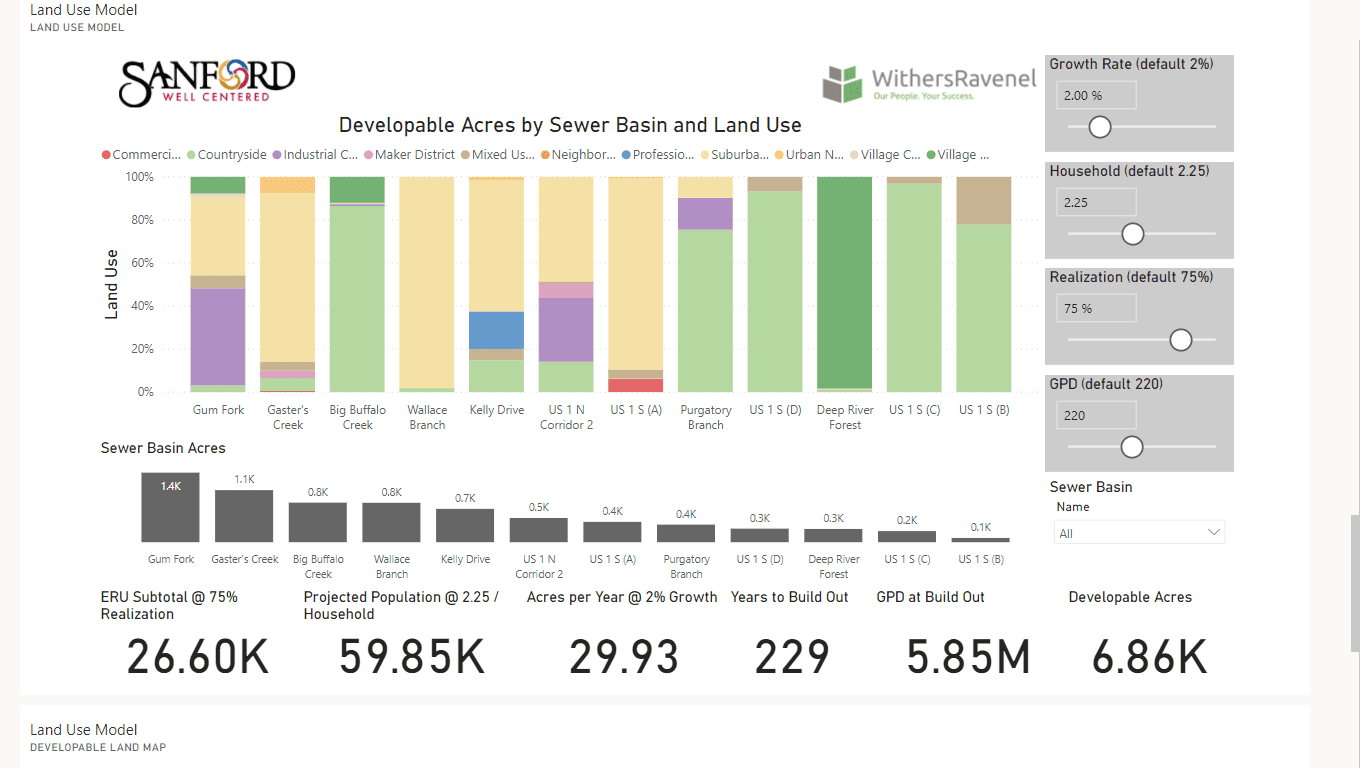
With this foundation in place, WithersRavenel created an interactive land use model like the sewer model. The model is presented in a dashboard with two primary views: a graph of developable acres by sewer basin and land use, and a map of property locations.
The developable acres view is a stacked bar graph showing the distribution of land use types within each sewer basin. When a basin is selected, it uses breakout boxes to display the number of developable acres, population, time until full build-out, and gallons of sewage produced per day. Sliders allow the user to adjust the population growth rate, number of individuals per household, and average gallons of sewage produced per day for one household. By adjusting these sliders, the City can see the effects of different development trends on population and the resulting sewer demand in real time.

The map view shows the locations of all developable property with color-coding to indicate land use categories. When a user hovers over a specific property, details like its size and cost appear. Clicking and dragging allows a user to see, at a glance, the associated sewer costs to develop those properties, including cost per acre and ERU (equivalent Residential Unit) of all Sewer Capital Costs.
What’s Next in Proactive Asset Management?
The sewer model has been so successful that the City has already begun working with WithersRavenel on a companion model for water infrastructure.
The land use model is slated to get an upgrade that incorporates return on investment from development via tax revenue.
Conclusion
Asset management plans help utility owners manage their systems proactively. By anticipating the real service life of water, wastewater, and stormwater systems, utility owners can invest in rehabilitation projects to extend service life, plan for replacements before assets breaks down, and understand the effects of development on future utility needs.
If you are a utility owner looking for a better way to visualize how funding and development decisions will affect your system today, tomorrow, and beyond, reach out to Chief Experience and Innovation Officer Eddie Staley at (919) 535-5207 or estaley@withersravenel.com to discuss your custom proactive asset management solution.
