Fuquay-Varina tackled asset management uncertainty with comprehensive lifecycle modeling
If you asked Adam Mitchell, being a town manager is a bit like driving a bus: the community is counting on you to get them where they want to go. Leading as town manager without the support of robust data? That’s like driving a bus down a highway at night with no headlights: you stick to one lane, maintain speed, and hope nothing unexpected lands in your path.
Adam and the Town of Fuquay-Varina don’t want to be driving blind, so they turned to comprehensive lifecycle modeling to reduce uncertainty about the future of their pavement, water, sewer, and stormwater networks.
Understanding the predictive strength of data with the Cone of Uncertainty
Planning for the future involves uncertainty. How much uncertainty depends on the quality of the data used to make our predictions and how distant a horizon we’re considering. Extensive data projected over a short term tends to produce more accurate predictions, while incomplete or dubious data extrapolated far into the future is liable to yield widely varying results, including both accurate and inaccurate predictions.
One way to visualize the relationship between data, time, and uncertainty is the Cone of Uncertainty.
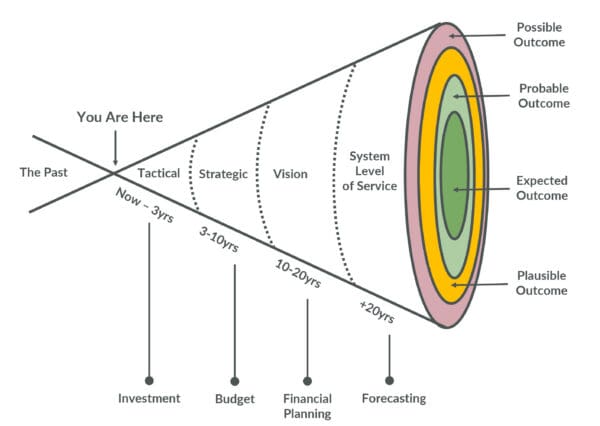
The Cone of Uncertainty shows how for any given set of circumstances, the range of what is possible, plausible, probable, and expected will expand the further into the future we look. Crucially, any uncertainty in the present will be magnified in the future.
If we want to narrow the Cone of Uncertainty so that our predictions contain more expected and probable outcomes and fewer merely plausible or possible outcomes, then we must reduce our uncertainty in the present by collecting more and better data.
Fuquay-Varina faced off against uncertainty in their asset networks
Fuquay-Varina maintained its own pavement, water, sewer, and stormwater networks. Each network had a corresponding GIS database.
Pavement
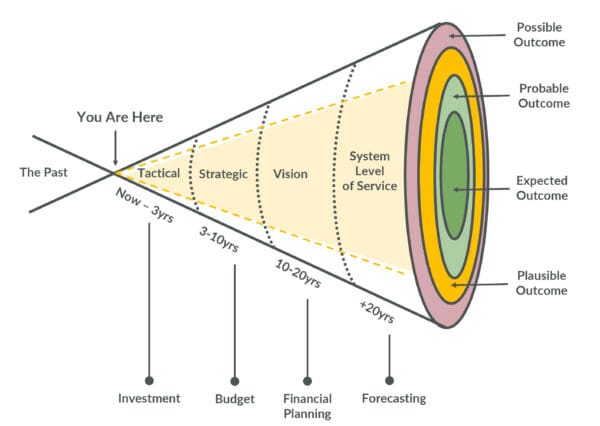
Because the Town had been completing routine pavement condition surveys every three years, they had a complete inventory of their roadway network that included up-to-date condition data. If they were to use this data to predict the state of their roads in 20 years or more, they could expect their predictions to encompass mostly expected outcomes.

To take their pavement data from great to excellent, WithersRavenel recommended incorporating repaving history along with location and condition, which would enable better lifecycle model calibration.
Water & Sewer
The Town’s picture of its water and sewer network was good but not quite as clear as that of its pavement. While they did have data about the location and size of pipes, pump stations, and treatment facilities, they were missing key asset attributes, particularly for older portions of the system. Specifically, they did not have complete key performance indicators (KPIs) for asset criticality and failure, which meant it would be more difficult to predict precisely which assets are likely to fail over the next two decades. Predictions werelikely to be a mix of outcomes they could reasonably expect along with a smattering of probable or plausible outcomes that may or may not come to pass.
To improve their predictive capabilities, WithersRavenel recommended conducting an asset condition assessment to collect missing KPIs.
Stormwater
The Town’s stormwater asset data was the least developed of their four networks. For communities that do not operate a stormwater utility enterprise fund, this is common: without a dedicated source of revenue to draw from, stormwater repairs or improvements are typically made on an ad hoc basis with money from the municipality’s general fund when it is available. Asset data collection is often similarly informal, resulting in data that is not necessarily bad but likely incomplete.
Fuquay-Varina was missing a complete asset register, as well as KPIs related to asset criticality and failure. Predictions based on the available data would cover a wide range of outcomes from expected to possible, with almost no certainty about the likelihood of any particular outcome.

WithersRavenel recommended conducting a combined asset inventory and asset assessment to collect the missing data.
Advanced lifecycle modeling with a CommonCorridor™ approach
Fuquay-Varina had enough data for its pavement, water, sewer, and stormwater assets to create a lifecycle model for each network. But as demonstrated above, the predictive value of each model would vary at first. As the quantity and quality of data improved, the models would be able to more accurately project the effects of various treatment approaches and financial strategies on service levels and work backlog.
But the Town had their eyes on an even bigger prize: an integrated lifecycle model that will allow them to make decisions based on geography. As Fuquay-Varina grows, staff want to be able to coordinate treatment activities across asset types that share a “common corridor,” such as repairing above-ground and buried infrastructure while replacing a roadway. The CommonCorridor™ approach avoids rework, reduces mobilization costs, and minimizes disruptions to the surrounding community.
The bottom line
Fuquay-Varina was equipped with a unified, multi-asset management strategy that minimizes lifecycle costs while maximizing service outcomes across its infrastructure network. As infrastructure is added or changed, funding levels evolve, or new treatment approaches are considered, the model will evolve to remain relevant to the Town’s planning process.